An Overview of SRUM Forensics
Often there comes a scenario where a malware has run on the host system and there is suspicion of data exfiltration. One forensic technique that comes in handy in such situations is SRUM forensics.
Introduction to System Resource Usage Monitor
SRUM was first introduced in Windows 8 operating system for keeping a track of system resource usage. In particular, information such as process owner, CPU cycles used by the process, data bytes read/written, network data sent/received, Windows push notifications and energy usage is continuously recorded.
SRUM is part of diagnostic policy service and it monitors desktop applications, programs, services, windows applications and network connections. The data that is visualized when one open’s the task manager is part of SRUM data feed.
The SRUM data collection happens once in every hour and at shut down. SRUM uses the below extensions for monitoring and data collection.
Source: Windows 8 SRUM Forensics - SANS DFIR Summit 2015(Slides) by Yogesh Khatri
SRUM Forensics
The concept of SRUM forensics was first introduced by Yogesh Khatri in his research paper "Forensic implications of System Resource Usage Monitor (SRUM) data in Windows 8".
SRUM data is temporarily stored in registry at “HKLM\SOFTWARE\Microsoft\Windows NT\CurrentVersion\SRUM\Extensions” and once every hour this data is moved to ESE database on disk located at “C:\Windows\System32\sru\SRUDB.dat”.
The following artifacts can be retired through SRUM:
For the scope of this blog, we would be exploring SRUM through a use case.
In our use case we would be executing a meterpreter payload inside a windows 10 box and downloading a document using our meterpreter shell.
Later, using the SRUM forensic artifacts we would try to establish whether data exfiltration was successful.
Let’s begin by creating our payload using msfvenom.
Our payload can be transferred to our victim box using any of the delivery method. Cause we are in a lab environment we will be using a python http server module for dropping our payload.
Once we run the payload on victim box, a meterpreter shell is spawn.
We were able to exfiltrate a document from out victim box. Let’s now move to the forensic part.
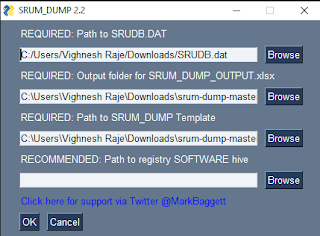
For paring the SRUM database file, we will be using srum-dump tool developed by Mark Baggett. You can download srum-dump from here.
Let’s now examine the artifacts related to out payload.
Here, we could find artifacts like SRUM entry creation date, SID of user under whose privilege the application was executed, CPU cycles, I/O bytes read and written, number of read/write operations etc.
Further we could look for network artifacts related to our payload execution.
Here, we could see the number of bytes sent, which in this case is 716000 bytes (716 KB). The size of our resource document is 655 KB. So in our case the number of bytes sent is more than the size of resource in question for exfiltration. Based on this information we can make an assumption that data exfiltration might have succeed.
For more detailed understanding of SRUM, refer to a SANS DFIR summit talk, titled “Windows 8 SRUM forensics” by Yogesh Khatri. You can find the link for the same here.
References
1. "Forensic implications of System Resource Usage Monitor (SRUM) data in Windows 8" by Yogesh Khatri dated March 2015 https://www.researchgate.net/publication/272239531_Forensic_implications_of_System_Resource_Usage_Monitor_SRUM_data_in_Windows_8
2. https://digital-forensics.sans.org/summit-archives/file/summit-archive-1492184583.pdf
3. https://github.com/MarkBaggett/srum-dump


Comments
Post a Comment